
Know what every prompt costs, the moment it runs
AI decision intelligence & interactive analytics
DataPulse turns provider invoices, agent traces, and cache metrics into one live view. Slice cost by user, project, or route - and catch a regression before it reaches your bill.
4.7 on Capterra · No credit card required
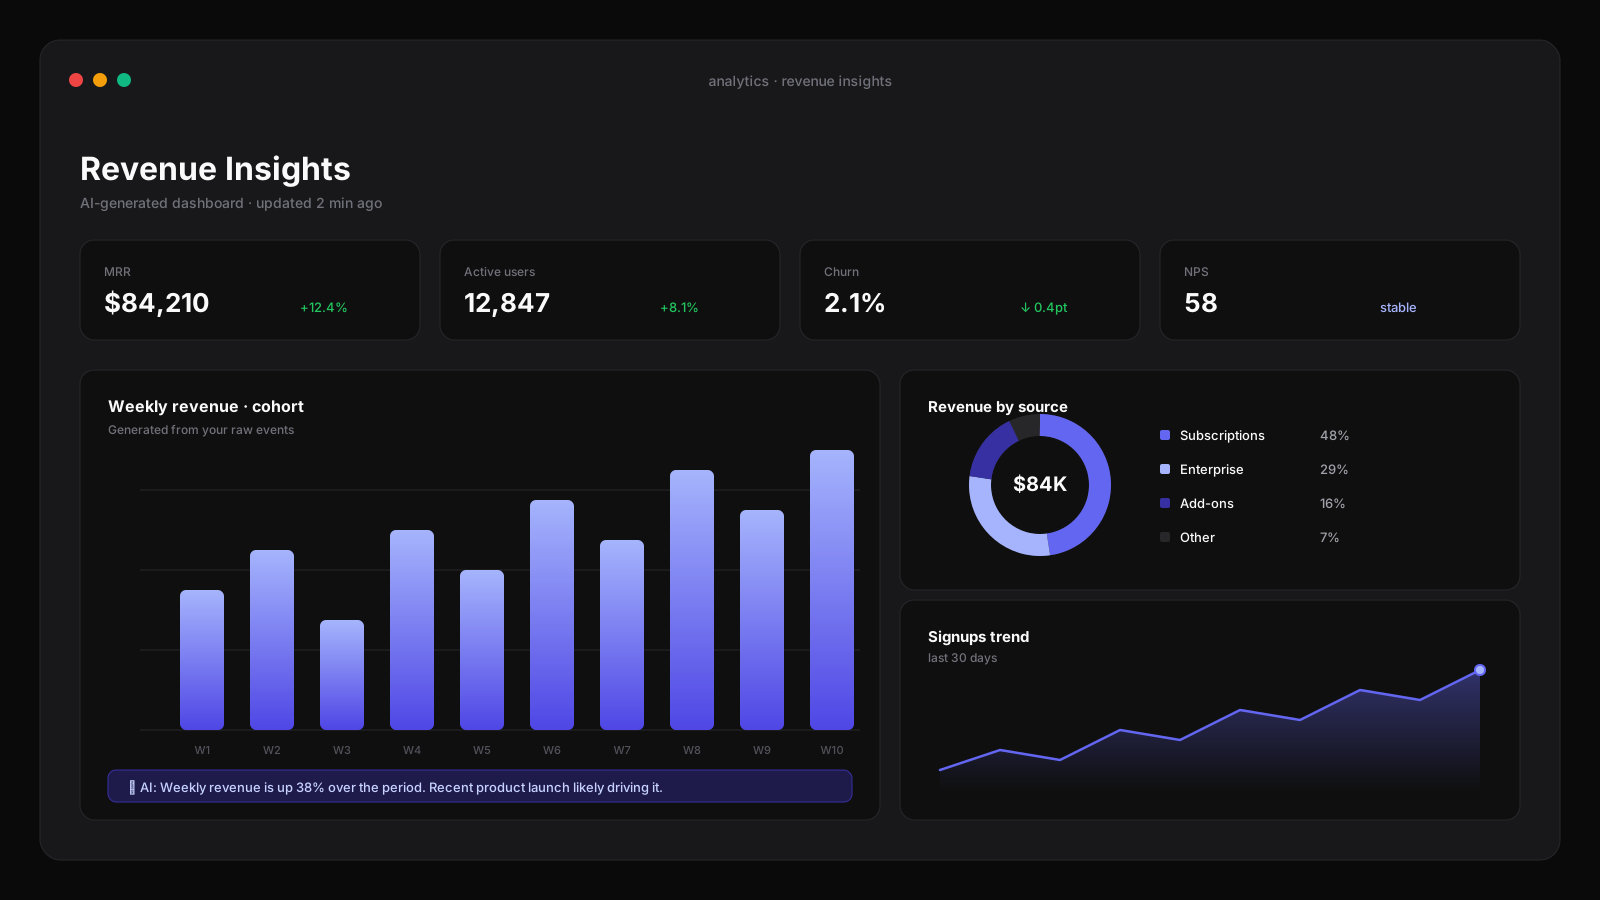
Get analytics over every request
Live cost per request. Alerts before budget overrun.
- Requests today
- 104,887
- Spend today
- $1,284
- Spend cut
- 31%
Why DataPulse
An AI-native Decision Intelligence Platform that transforms data into insights, predictions, and actionable decisions through interactive analytics, statistical intelligence, and explainable AI.
Granularity
Every request carries its cost, latency, model, and cache outcome, so spend slices by user, project, route, or feature flag.
Immediacy
Dashboards update as traffic lands, and alerts on budget overruns, p95 latency, or prompt drift reach Slack and PagerDuty.
Portability
The warehouse is yours - export to Grafana, Datadog, or your data lake with no sampling and no lock-in.
How DataPulse empowers your team
6 capabilities, and what each one actually does once real traffic is flowing through it. Pick one to see it in the interface.
Real-time ingest
Requests appear on the dashboard within seconds, not on tomorrow's invoice.

Slice any dimension
Break spend down by user, project, route, model, or a custom tag you attach.
Regression alerts
Get paged on prompt drift, p95 latency spikes, and budget thresholds.

Cache visibility
See hit rate, savings, and which prompts are burning tokens they shouldn't.
Export anywhere
Stream to Grafana, Datadog, S3, or your warehouse. Your data stays yours.
Team budgets
Give each team a ceiling and let them watch their own burn rate.
Teams already running DataPulse
What changed for them after the switch - in their words, not ours.
We found a single retry loop that was quietly costing us four figures a week. DataPulse surfaced it in an afternoon.
Brainstorm mode unlocked 3x faster ideation across our research team. It feels like extra teammates.
Switched from a homegrown router. Cache hit rate jumped from 12% to 87%. Same answers, 8x cheaper.
Walkthrough
See your workflow running in DataPulse
Set thresholds on spend, latency, and error rate. DataPulse routes the alert to wherever your team already looks.
SOC 2 Type II
Report available under NDA for Enterprise customers.
GDPR & CCPA
Access, deletion, objection, and restriction rights honoured.
DPA on request
Negotiated MSA and data processing agreement for Enterprise.
Zero retention
Provider zero-retention routing wherever the provider offers it.
Questions, answered
Still unsure whether DataPulse fits your stack? Talk to an engineer - no sales script.
Contact engineeringDoes DataPulse sample requests?
No. Every request is recorded with full cost and latency detail. Sampling hides exactly the outliers you need to see.
How does it get provider costs?
It reads token usage from each response and prices it against current provider rates, then reconciles against your actual invoices monthly.
Can I keep the data in my own infrastructure?
Yes. Self-hosted deployments write to your warehouse, and export streams to Grafana, Datadog, or S3 are available on every plan.
Does it work without LLM Routing?
It does. The SDK and proxy modes work with direct provider calls, though pairing the two gives you routing data as well.
Built to work together
All 8 platforms

Ready to try DataPulse?
Start free with 1M tokens included. No credit card, no SDR call.